Team & delivery
We put our whole team on a skill-will matrix — and backed it with delivery data
A 26-person roster went from a spreadsheet to a living team page: roles, skill-will quadrants, and per-person delivery scorecards computed from work that actually shipped.
26
members mapped in one import
4
quadrants, evidence attached
0
extra logging required
Every engineering org keeps a version of this spreadsheet: names, roles, products, and some private judgment about who's flying and who's struggling. Ours had 26 people across four products, with a skill-will code per person — high/low effort crossed with high/low skill.
We moved it into UltiPad in an afternoon. The roster isn't a separate list to maintain: members and their product assignments come straight from workspace permissions, so the team page can't drift from reality. Admins overlay the judgment — role, skills, and a performance band — and the bands are stripped server-side for everyone else. Sensitive data stays sensitive.
The matrix view
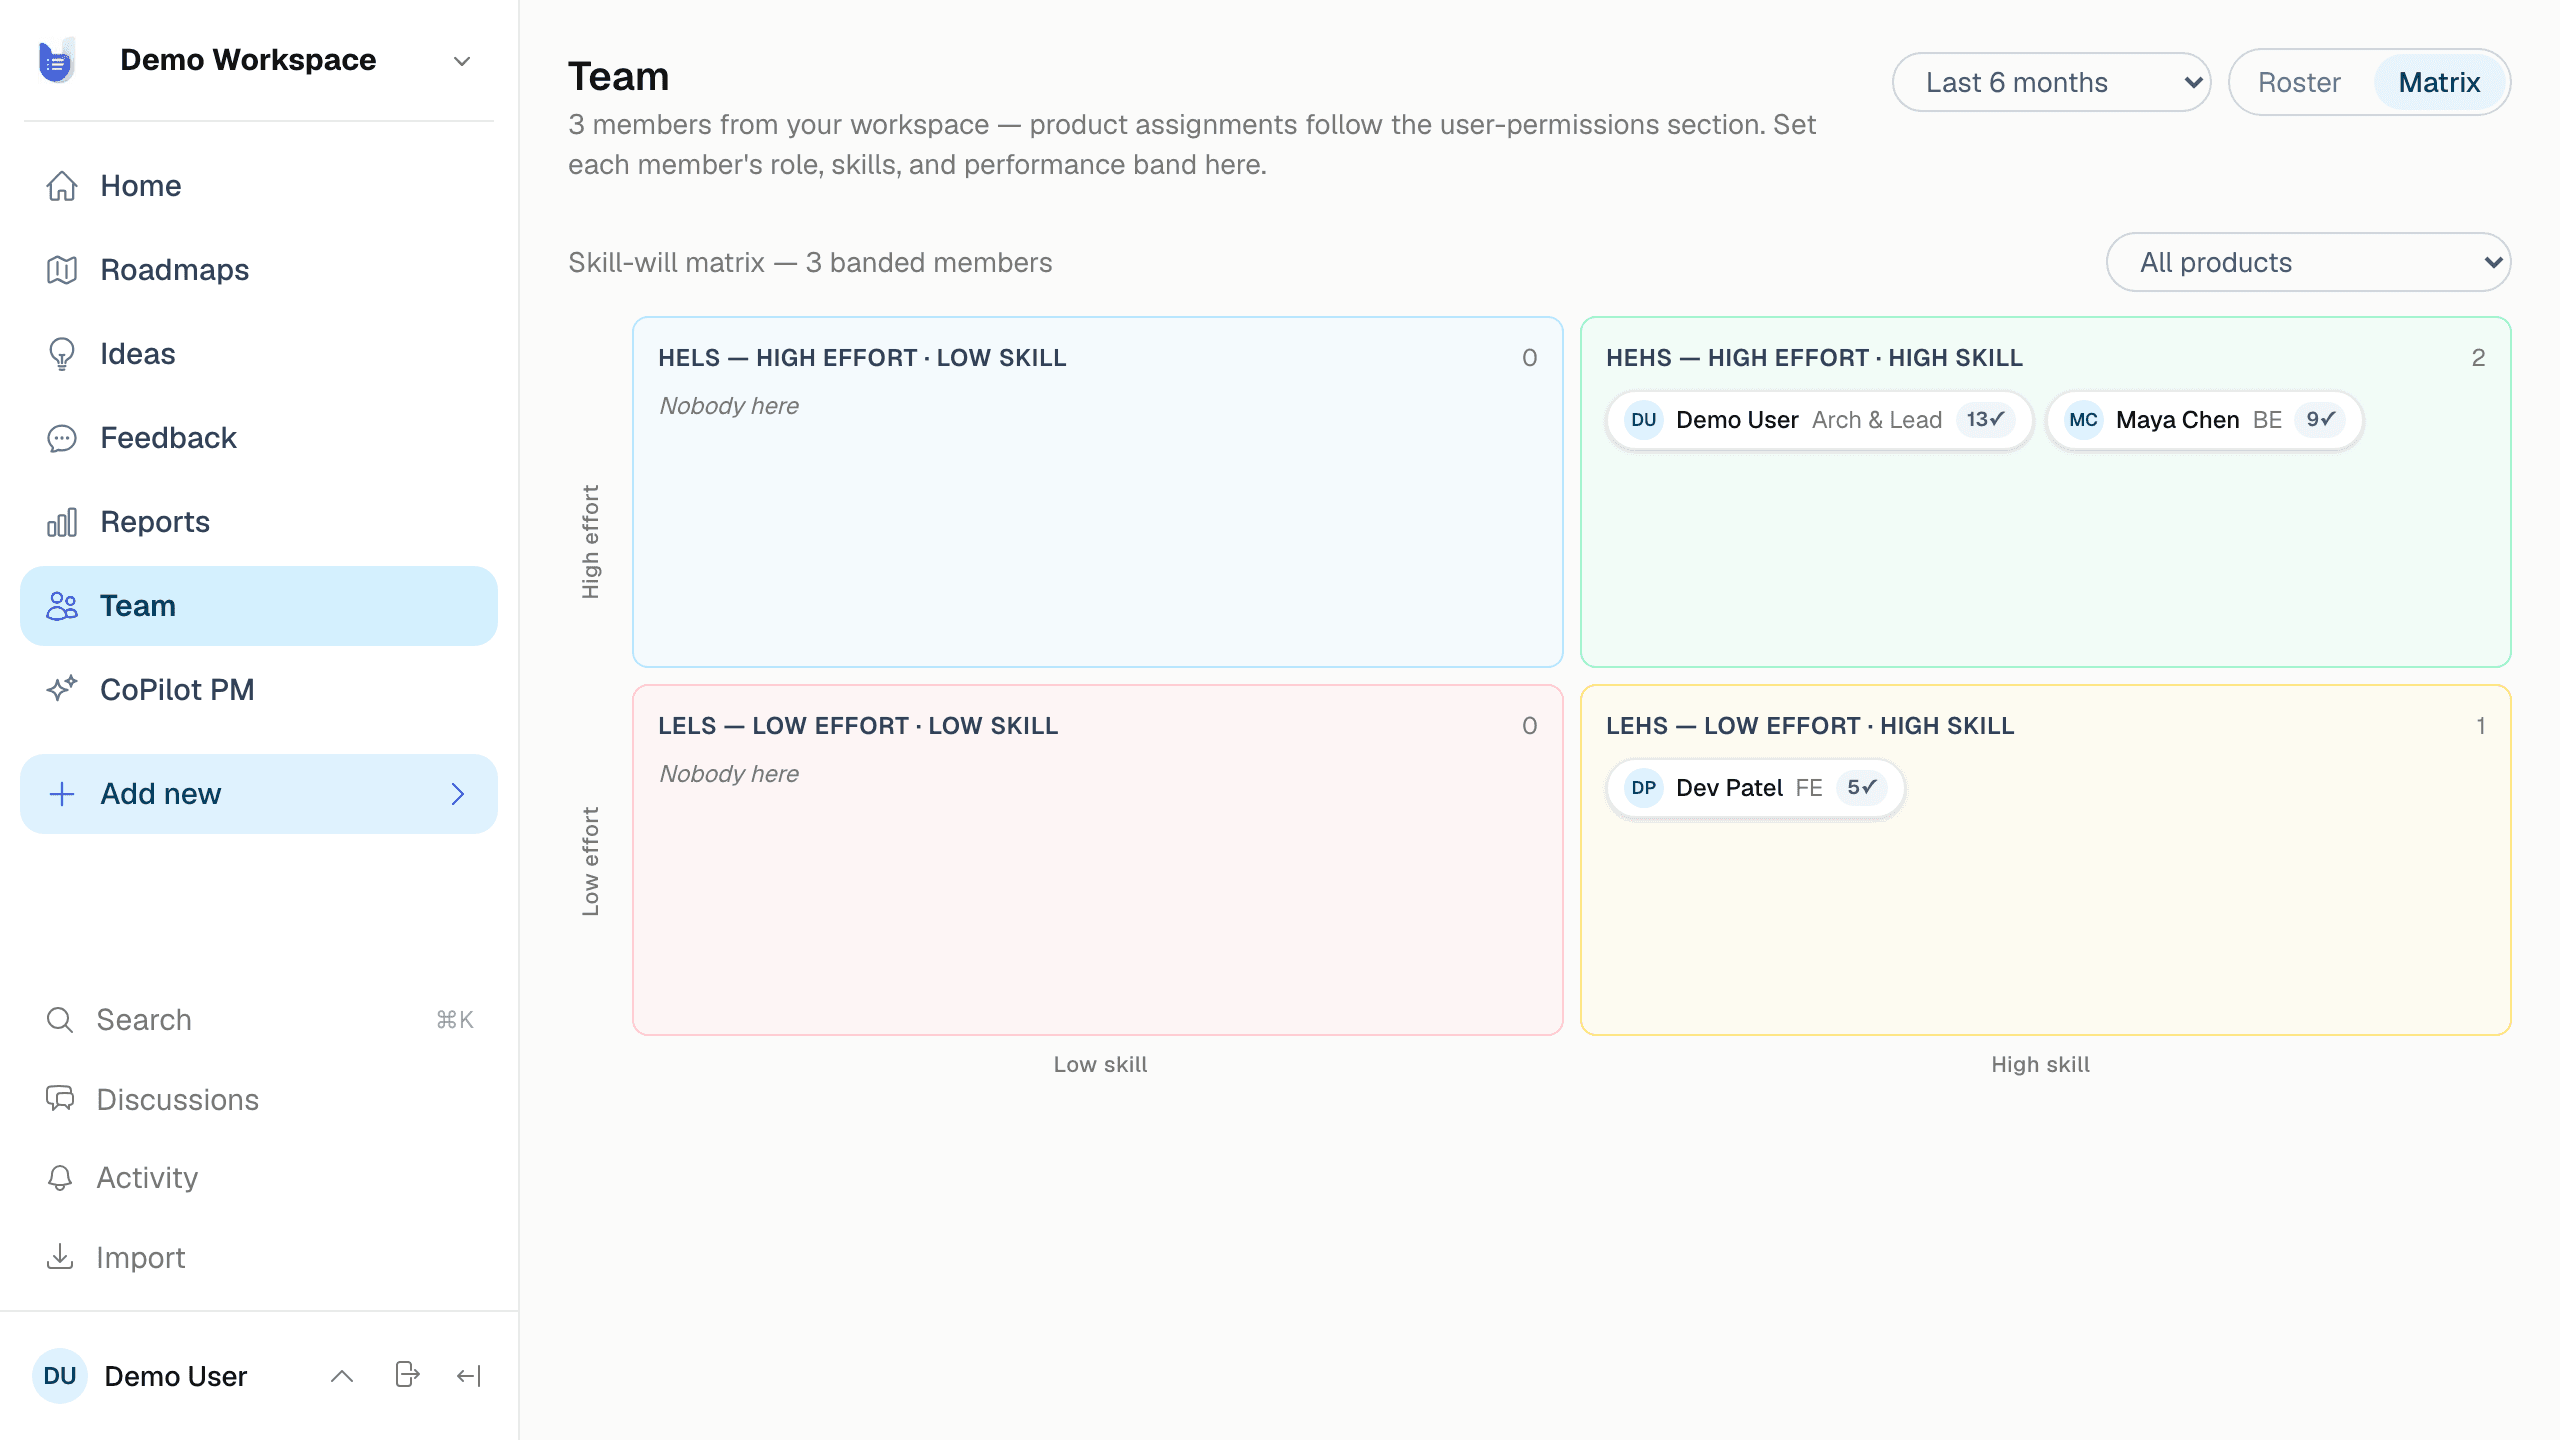
One toggle renders the four-quadrant chart: stars top-right, coaching cases mapped honestly, every chip clickable to edit. Filter by product to see a single team's shape. For a manager, this is the annual-review conversation made visible year-round — and updateable in two clicks when someone grows.
Judgment, meet evidence
The bands are opinions. So UltiPad puts delivery evidence beside them: for each member, how many owned ideas actually reached Done, the on-time rate against due dates, median cycle time from In Progress to delivered, rework signals (work bouncing backwards from QA), and current in-flight load — all computed from stage transitions the tool already records. Nobody fills in a timesheet.
When you open someone's edit dialog to set a band, their scorecard is right there. The tool doesn't rate people — sample sizes are small and context matters — but it makes sure the human doing the rating is looking at what shipped, not at who talks loudest in standup.
Run this loop on your own product.
We're onboarding teams in waves — join the waitlist and we'll open your workspace.
Join the waitlistRead next
Six reports, zero spreadsheet exports: how we run the week on live data
Weekly status, delivery funnel, AI-vs-human contribution, cycle-time efficiency, and OKR progress — filtered by product, line, stage, or date range, with CSV export when you need the raw rows.
Operations & internal teams: an intake queue that proves its own SLA
IT, HR, and ops requests get the triage inbox, due-date tracking, and per-owner delivery evidence — cycle times and on-time rates computed from the workflow itself.