Product management
Six reports, zero spreadsheet exports: how we run the week on live data
Weekly status, delivery funnel, AI-vs-human contribution, cycle-time efficiency, and OKR progress — filtered by product, line, stage, or date range, with CSV export when you need the raw rows.
6
report tabs, one data source
+3,028
AI lines visible in Delivery
1 click
to export any view as CSV
Reporting usually means someone spends Friday assembling screenshots into a deck. Ours assembles itself, because every chart reads the same records the work already produced: ideas, stage transitions, commits, feedback, and objectives.
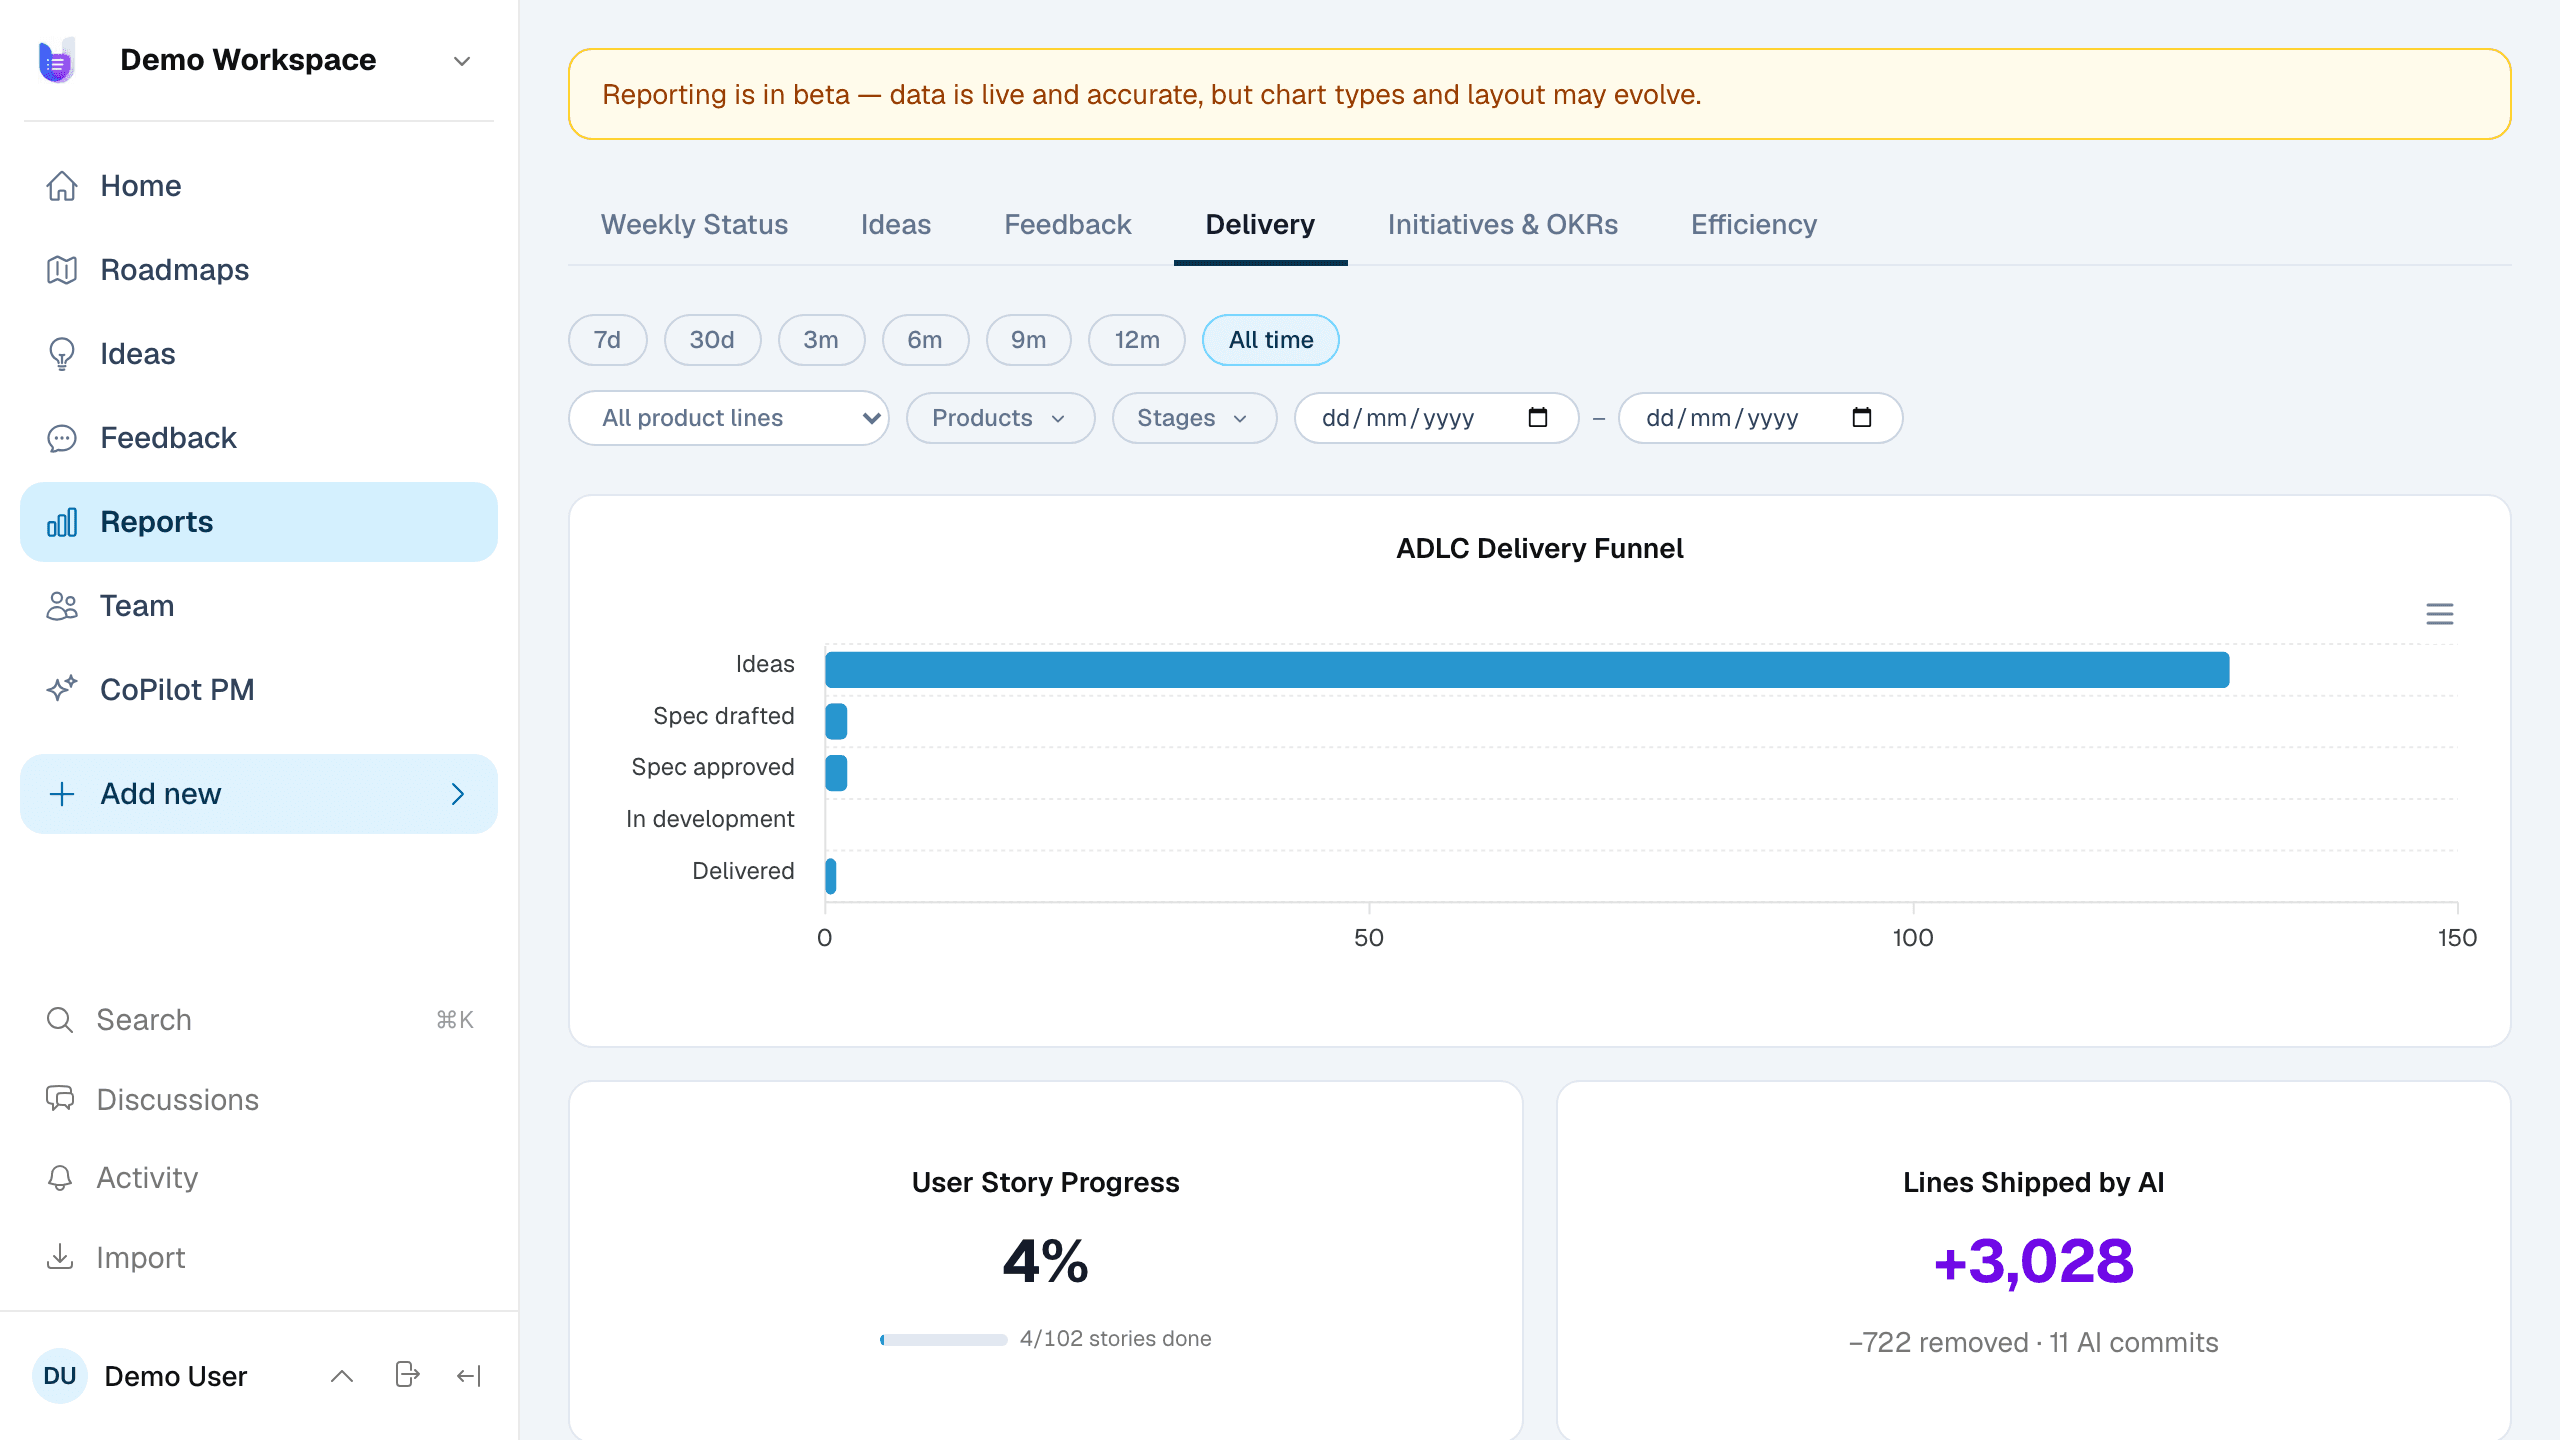
The Reports section has six tabs. Weekly Status opens on a 7-day pulse of what moved. Ideas shows the backlog's shape — per state, per owner, due-date health. Feedback tracks volume by channel and month. Delivery is the ADLC tab: the funnel from idea to spec to delivered, commits per month, AI-created versus human-created work, and Lines Shipped by AI. Initiatives & OKRs ties execution to objectives, and Efficiency measures average days per workflow stage so bottlenecks name themselves.
Filters that respect how orgs actually ask questions
Every report accepts the same filter bar: product line, individual products, workflow stages, preset ranges from 7 days to all time, or exact custom dates. "How did Checkout do last quarter?" is a filter, not a data request to an analyst. Product-scoped users see only their products' data — the same visibility rules as everywhere else in the workspace, enforced server-side.
The chart nobody else has
Because agent commits carry diff stats and a source stamp, the Delivery tab can answer the 2026 question: how much of our shipped code did AI write? In our workspace the card reads +3,028 lines across the agent's commits — a number that updates itself with every push, not a quarterly estimate.
And when someone upstream wants the raw rows anyway: every table view exports the current filtered, sorted state as CSV in one click — the same columns you see, not a dump you have to re-clean.
Run this loop on your own product.
We're onboarding teams in waves — join the waitlist and we'll open your workspace.
Join the waitlistRead next
A user reported a missing API at breakfast. It was in production by lunch.
An external user hit a documented endpoint that didn't exist. The report became an idea, the idea became a spec, an agent built it — deployed, rate-limited, and verified the same day.
We put our whole team on a skill-will matrix — and backed it with delivery data
A 26-person roster went from a spreadsheet to a living team page: roles, skill-will quadrants, and per-person delivery scorecards computed from work that actually shipped.